OEE Pilot – Features in Detail
- Live Dashboard & Scoreboard: OEE and production status in real time, directly at the line
- OEE Analysis – Live and historical: Availability, Performance, Quality by shift, product, or time period
- Bottleneck Analysis: Identify bottlenecks live and analyze them historically
- Production Programs: Product-specific line configuration — cycle times, stations, target quantities
- Part Counting: How OEE Pilot counts parts without PLC intervention
- Production Analysis: Throughput, cycle time, and sensor data per minute (with min/max values)
- Sensor Data & External Cycle Time: Capture and analyze additional sensor data and timings in parallel with production
- User Interface: Dashboards for line, shop floor, and office — no installation required
- PineDisplay: Dedicated display system for permanent use at the line
- Reports: Automatic PDF reports via scheduler or after a production run
- AI Add-on: Query production data in plain language — GDPR-compliant, European provider
- Operating Modes & Network: Dedicated AP, LAN, or IT system integration
- Scaling: More than 4 sensors using additional Pineboxes
- Backup & Data Security: USB, server rsync, or Pinetek Managed Backup
- Additional Features: Alerts and language support
Live Dashboard & Scoreboard
OEE Pilot continuously calculates OEE from three components:
- Availability: Proportion of scheduled time during which the equipment is actually producing
- Performance: Ratio of actual cycle time to target cycle time
- Quality: Proportion of good parts relative to the first pass yield
Downtime and line startup are detected automatically. When an unplanned stoppage occurs, the operator is prompted to enter a category and reason, along with any additional information. This enables detailed analysis of recurring issues and supports root cause resolution for improved productivity.
The Scoreboard displays the current production status in real time: current product, part count, OEE value, stoppages.
Designed to be visible to all operators directly at the line via PineDisplay, on a tablet, or in the office. No login required — any browser will do. The dashboard updates automatically and is optimized for large-screen displays.
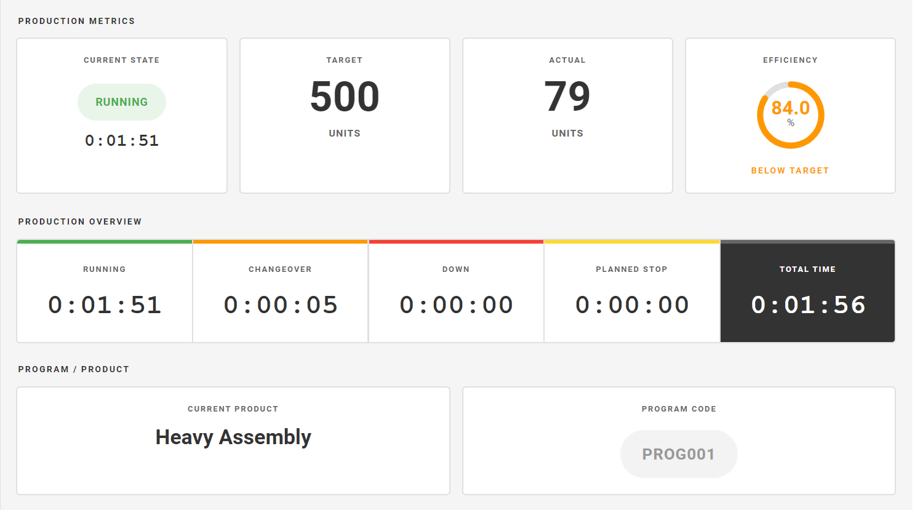
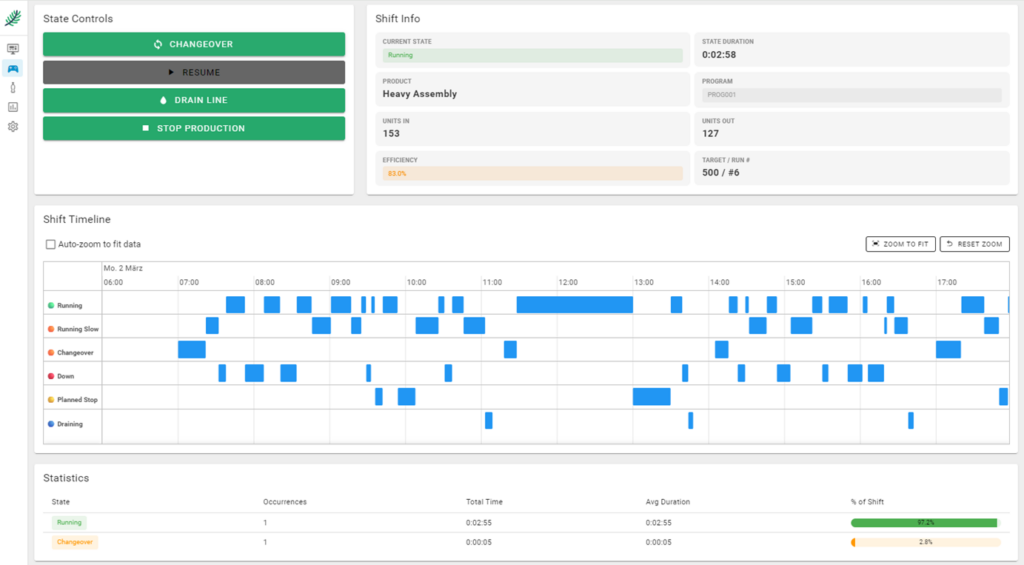
The Production Overview shows the production runs of the current day along with their respective statuses, giving operators and shift supervisors a quick overview of the day’s activity.
The Production Overview also serves as a control interface: setting up a new product (changeover), ending a production run (draining).
OEE Analysis
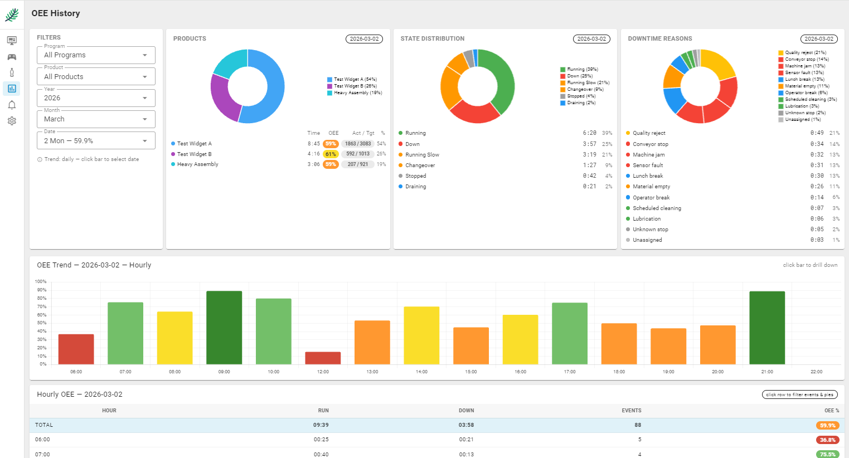
The OEE analysis allows evaluation of past production runs at multiple levels: by production run, product, production program, or freely selectable time period. Stoppages are logged with timestamp, duration, and frequency.
The view enables detailed analysis of failure causes, distribution of downtime, and hourly breakdowns. All events can be displayed and edited.
Bottleneck Analysis
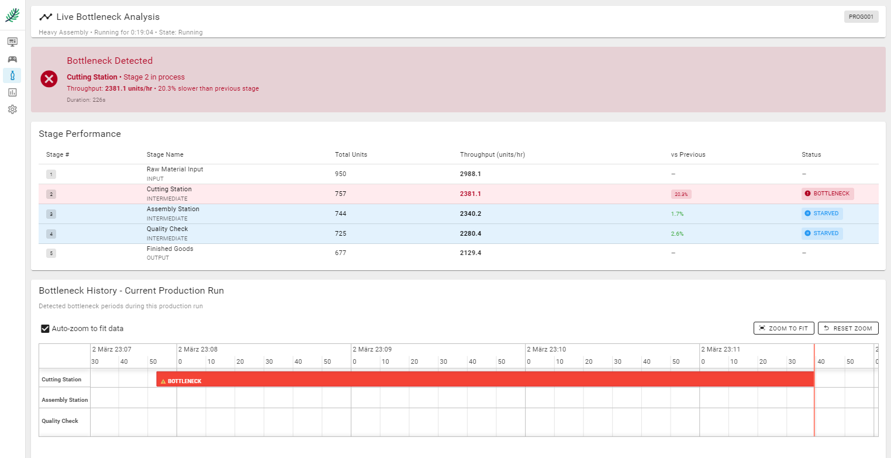
Live: OEE Pilot identifies in real time which station is slowing down the line. The bottleneck is visually highlighted and tracked over time, including frequency and cumulative lost time. This allows problems to be identified and resolved before a complete line stoppage occurs.
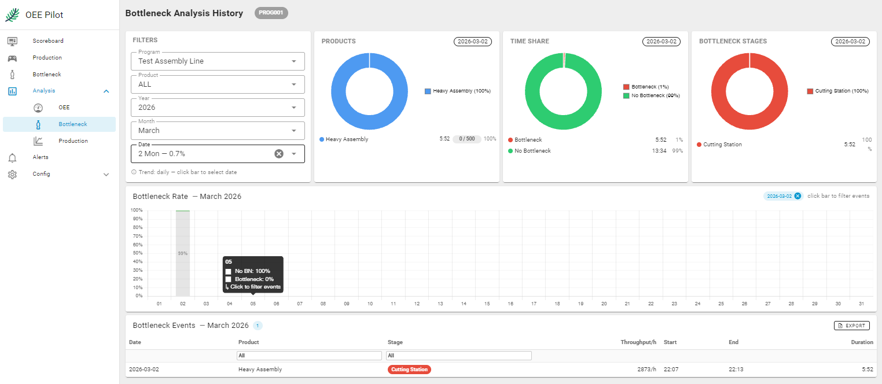
Historical: The bottleneck analysis allows evaluation of past production runs. Which station was the bottleneck, and how often? How did this change across shifts or product changeovers? This analysis forms the basis for targeted improvement measures.
Production Programs & Line Configuration
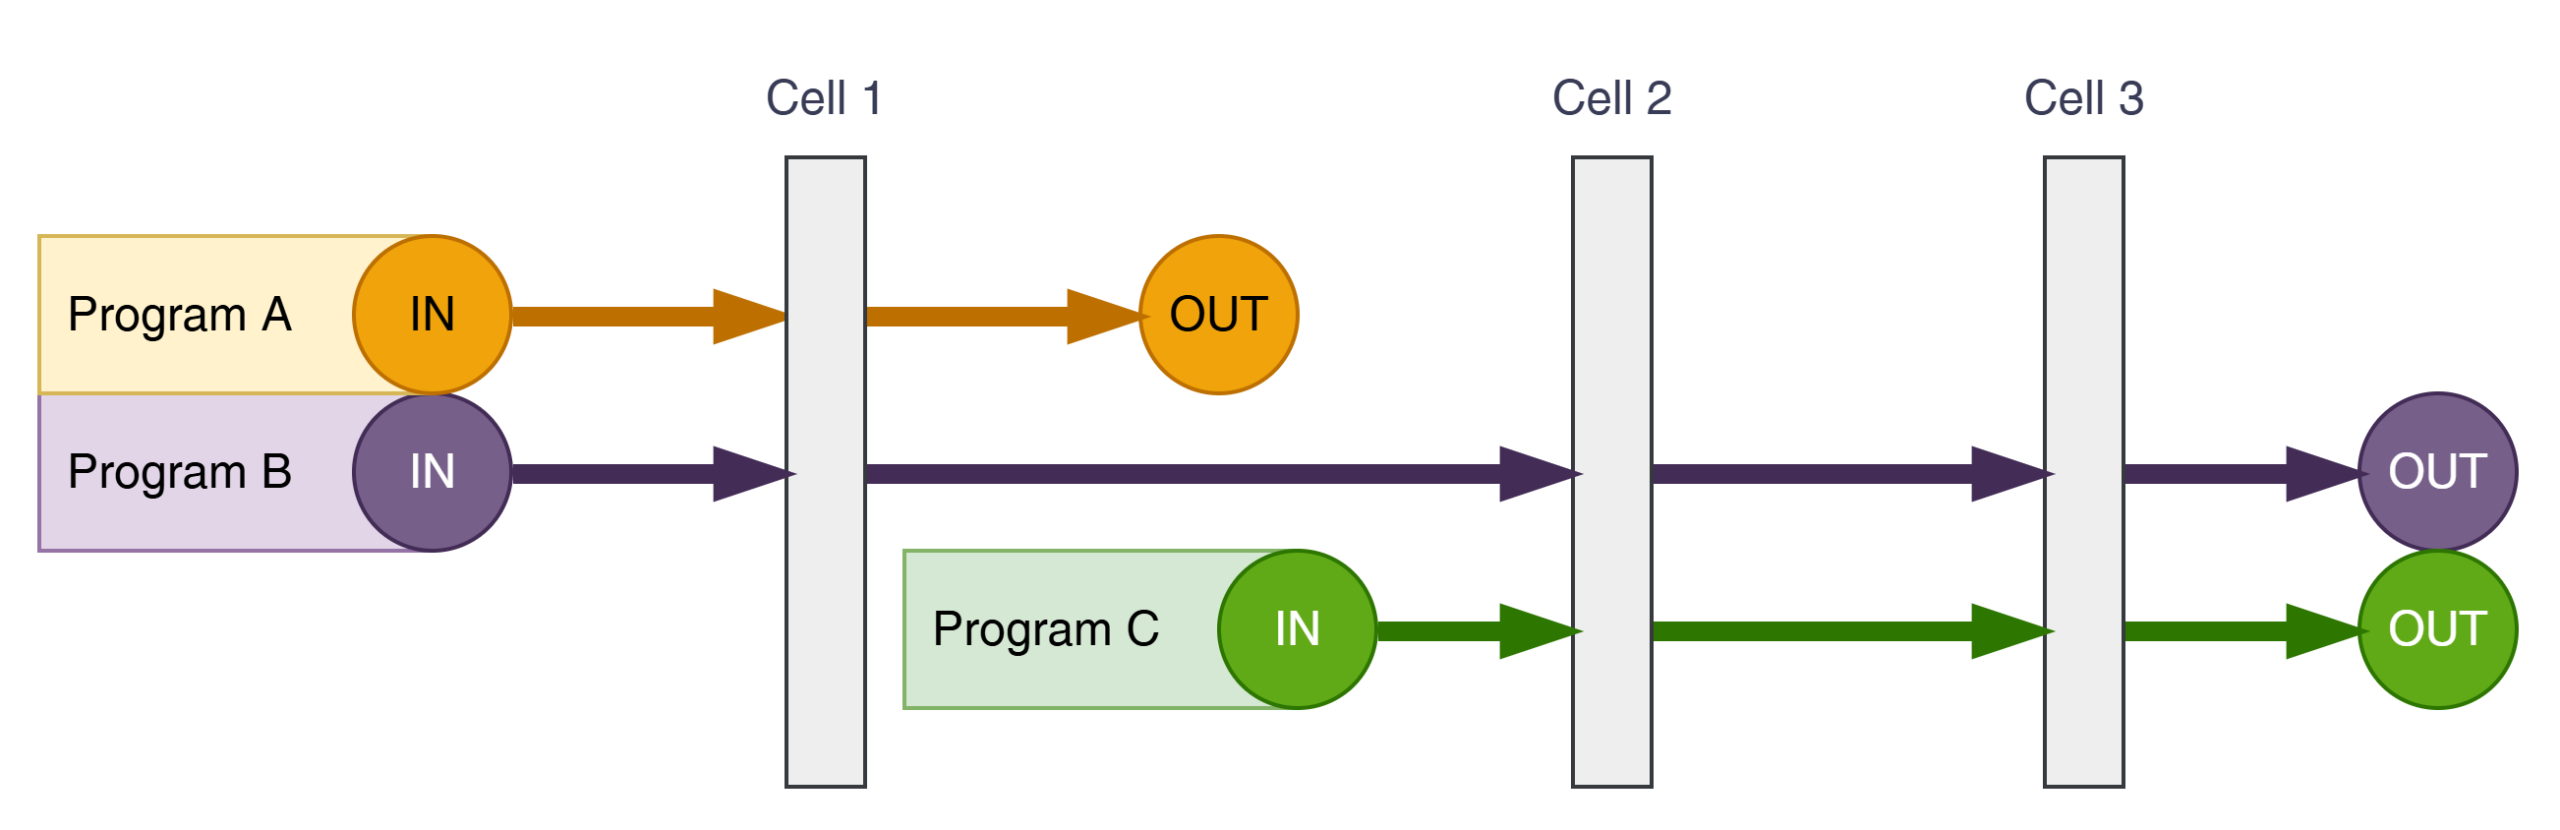
Not every product uses the line the same way. OEE Pilot supports product-specific line configurations via programs: Program A may require only a single cell, Program B uses the full line, and Program C uses only the last two stations. Cycle times and active stations are defined per production program. OEE calculation and bottleneck analysis adapt automatically — no manual reconfiguration during product changeovers.
Part Counting
OEE Pilot counts parts using IO-Link®1 sensors (or digital 24V sensors) mounted in parallel with the existing control system — no PLC intervention, no machine release required. Distance sensors are typically used: every part that passes the sensor is registered as a cycle. The counting logic is built into OEE Pilot and is configured per station.
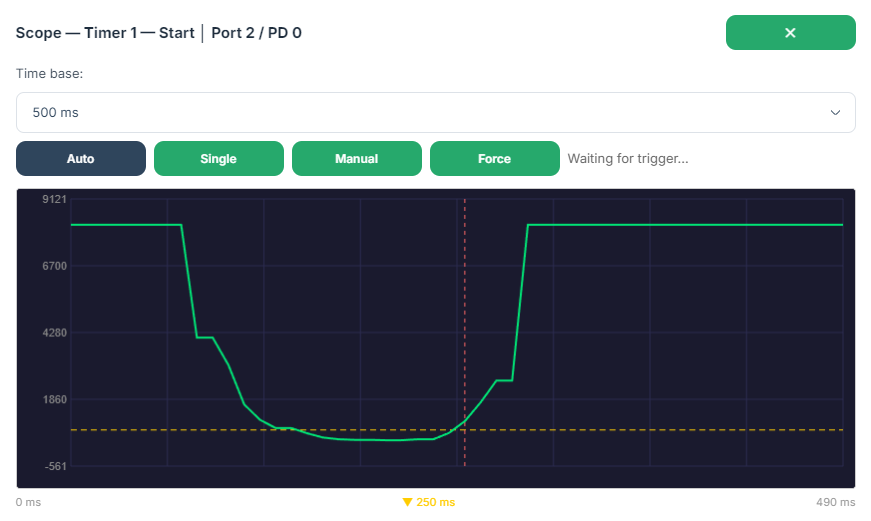
Sensors detect a part passing based on a signal edge. The built-in scope view allows threshold values to be optimally adjusted to avoid miscounts.
OEE Pilot evaluates the threshold values and, in combination with the production program, calculates the OEE value. All common IO-Link distance sensors and light barrier sensors are compatible (over 20,000 sensor types available in the IO-Link standard).
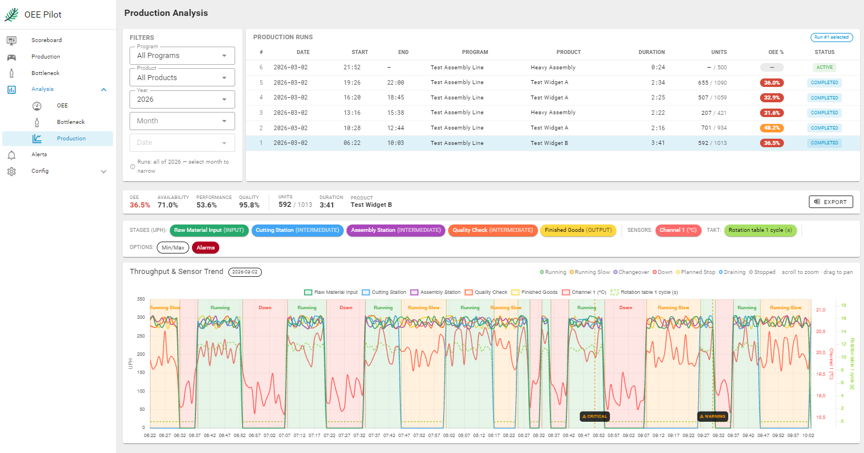
Production Analysis
The production analysis shows the detailed timeline of a production run: throughput per time unit, sensor data, and external cycle times — all on a shared time axis.
Per-minute resolution: Each data point represents one minute. In addition to the average, minimum and maximum values are shown for each data point. This makes brief outliers visible that would be lost in an average — particularly relevant for cycle time variations and sensor readings such as pressure or temperature.
Processing on the Pinebox: All analysis runs locally on the Pinebox — no cloud, no external processing. Even large datasets spanning multiple shifts or weeks are processed and visualized directly on the device.
Sensor Data & External Cycle Time
Sensor data: In parallel with part counting, OEE Pilot can read any IO-Link sensors: compressed air, temperature, vibration, distance, fill level — anything available in the IO-Link standard. With over 20,000 sensor types from all major manufacturers, the selection is virtually unlimited.
Sensor data is stored together with production data and displayed on the shared time axis in the production analysis view. Correlations between process parameters and production KPIs become directly visible — no additional analysis software required.
External cycle time: The cycle time of individual sub-processes or stations can be captured using additional IO-Link sensors — similar to part counting, but as supplementary information. A sensor detects the start and end of a cycle; OEE Pilot calculates the cycle time per pass. This makes it possible to identify which sub-process is driving up cycle time and whether variations are occurring.
“Has there been a correlation between temperature and scrap rate since the last maintenance?”
Analysis possibilities:
- Does a drop in air pressure lead to more handling errors?
- Which sub-process is driving up cycle time?
With the AI add-on, these questions can be asked directly in the interface using free-text prompts.
Operator Tablet & Dashboards
OEE Pilot requires no app and no installation on the client device — a browser is sufficient. Dashboards are optimized for different user groups:
- Scoreboard at the line: large-format display, current shift, OEE and part count at a glance
- Operator tablet on the shop floor: production control, start and end of production runs, downtime entry
- Management screen in the office: historical analysis, OEE trends, reports
Operators start and end production runs via the tablet interface, select the production program, and can log downtime reasons. All inputs are made through the browser interface — no password or training required for basic operation.
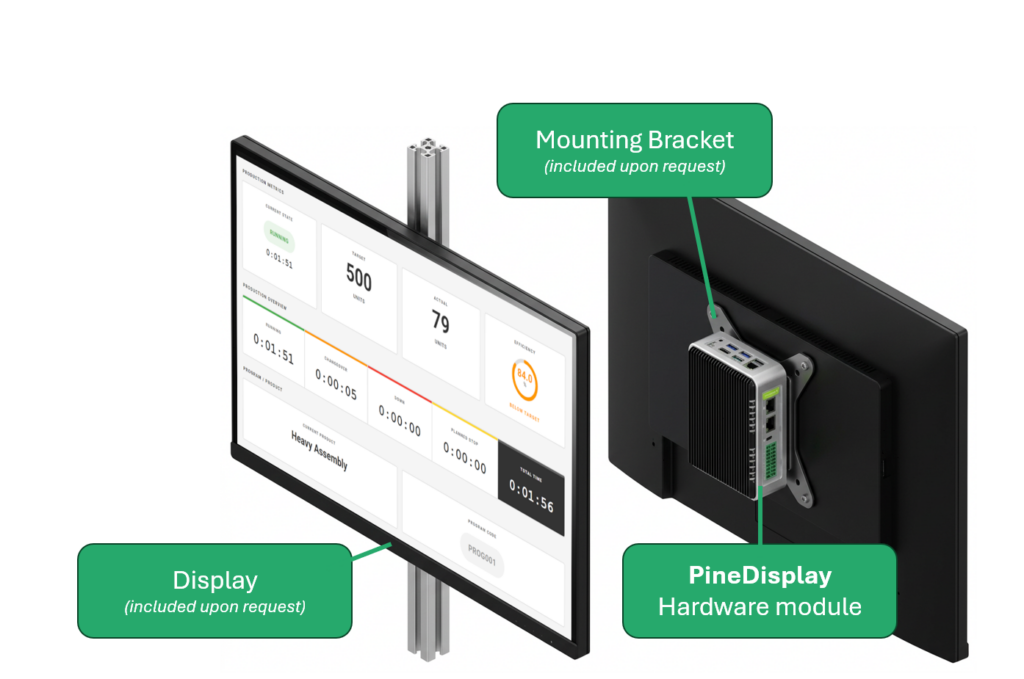
PineDisplay
PineDisplay is a dedicated hardware module for permanent use directly at the production line. It displays the OEE Pilot Scoreboard or other dashboards without an additional computer — compact, industrial-grade, and easy to mount.
Technical: PineDisplay uses Pinebox technology with integrated HDMI output, Wi-Fi, and Ethernet. The PineDisplay software automatically launches the dashboard on startup — no browser, no configuration required.
Price: €350 — one-time, no subscription.
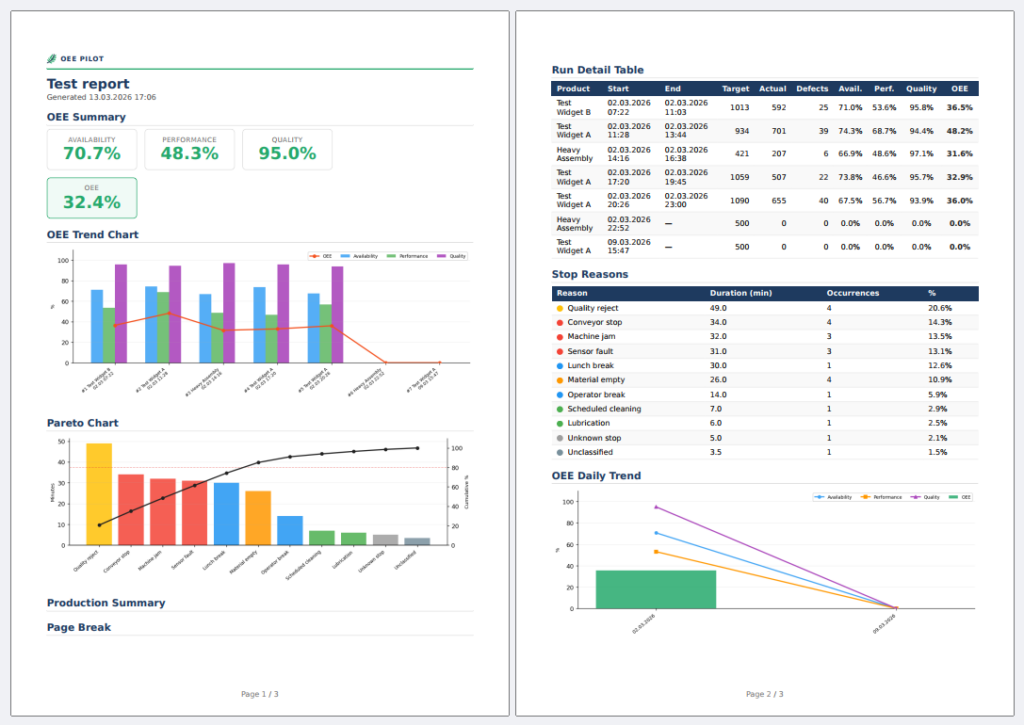
Reports
OEE Pilot automatically generates PDF reports — after a production run or via scheduler (daily, weekly, monthly). Reports are fully customizable: your own logo and layout, content, and recipient list are defined per configuration. Reports are sent by email directly from the device — no cloud required (SMTP mailbox needed).
Included report content (excerpt, configurable):
- OEE metrics (Availability, Performance, Quality)
- Bottleneck analysis
- Downtime log
- Production timeline with throughput and cycle time
- AI analysis (when AI module is active)
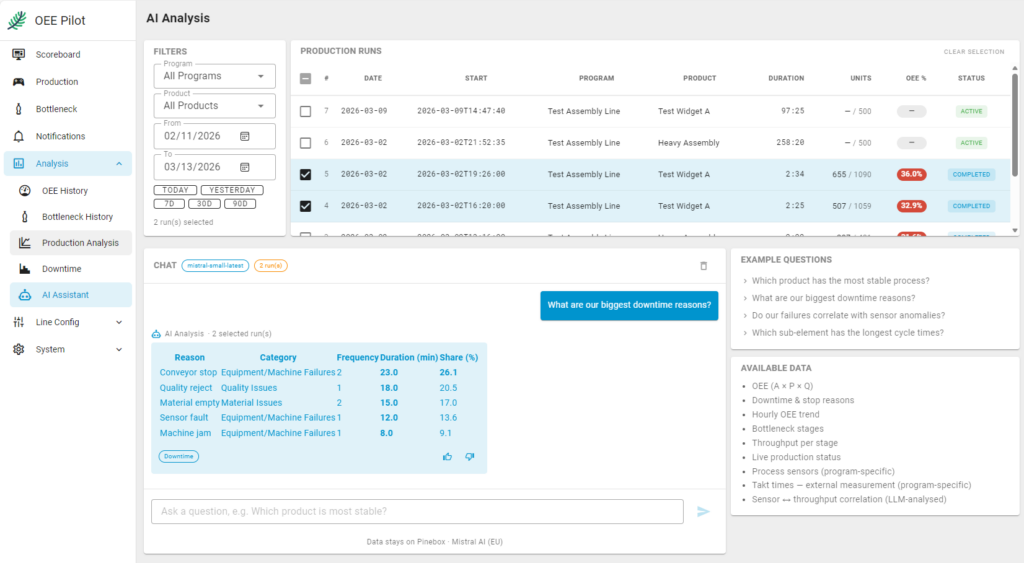
AI Add-on
The AI add-on enables analysis of production data via free-text queries. Typical questions: “What was the most common failure reason this week?” or “Compare the OEE of shift A and B over the last month.”
Technical background:
- Based on Mistral AI (European provider)
- Processing runs via the Pinetek server as a proxy; the AI provider never knows who is making the request
- Mistral does not store any customer data
- GDPR-compliant, no US cloud provider
AI processing is computationally intensive, which is why it is offered as an optional module. OEE Pilot works fully without AI. The module can be enabled or disabled at any time.
Available as:
- Prompt input directly in the interface
- Automatic AI analysis in the report
Price: €20/month, cancel anytime.
Operating Modes & Network
OEE Pilot runs fully on-premise on the Pinebox. Three operating modes are available for network connectivity:
- Dedicated access point: the Pinebox creates its own Wi-Fi network. No corporate network required — ideal for quick deployment or isolated lines.
- LAN / corporate network: the Pinebox is connected via Ethernet to the existing network. Dashboards and reports are accessible to all authorized users on the network.
- IT system integration: OEE data can be forwarded to higher-level systems (MES, ERP). Available interfaces on request.
An optional LTE/5G module is available for the Pinebox on request, enabling remote access via a secured VPN.
Scaling: More Than 4 Sensors
One OEE Pilot system supports up to 4 IO-Link sensors directly. For lines with more stations or additional sensors for process values and external cycle times, additional Pineboxes can be added. Each Pinebox operates as an independent unit; data from multiple units can be consolidated into a shared analysis view. The additional Pineboxes do not require OEE Pilot software — the standard pre-installed software is sufficient for the scaling function.
Details on scaling available on request.
Backup & Data Security
Production data is business-critical. OEE Pilot offers three backup options:
- Pinetek Managed Backup: backup service via Pinetek, fee-based. Data is encrypted and stored on a German server. For businesses without their own IT infrastructure. Details on request.
- USB backup: scheduled export to a USB drive, directly on the device
- Server backup via rsync: automatic backup to a local server on the corporate network, configurable via schedule
Additional Features
Alerts
OEE Pilot continuously monitors sensor and cycle time values and triggers an alert when defined thresholds are exceeded or undercut. Alerts are displayed in the browser interface as a notification box directly in the dashboard and in a dedicated alert list with timestamps and history. Thresholds and triggers are configured per production program, so different products can have different tolerances.
Multilingual support
OEE Pilot is currently available in German and English — both in the user interface and in automatically generated reports. The language is set globally per installation. Additional languages can be added on short notice. Contact us if your language is missing.
Ready to deploy in your production?
OEE Pilot is available from €4,800 — one-time, no subscription. 6-week trial available.
- IO-Link ist eine eingetragene Marke der PROFIBUS Nutzerorganisation e.V.: io-link.com, profibus.com
Die Pinebox ist kompatibel mit IO-Link-Geräten. Es handelt sich um keinen zertifizierten IO-Link-Master. ↩︎